



A gas analyzer may display accurate concentrations during calibration but respond too slowly to actual process changes. This delay can affect combustion control, emissions monitoring, gas recovery, and industrial process safety. For example, a gas analyzer may respond within 12 seconds during factory testing. However, its installed sampling system could require significantly longer to deliver a representative gas sample. This difference matters because the gas analyzer’s stated response time does not always represent the complete monitoring system.
To verify an industrial gas analyzer’s response time, introduce a controlled step change between two known gas concentrations. Record the time required for the output to reach a defined percentage of the final change, typically 90% (T90). Repeat the test under specified conditions, then compare direct gas analyzer response with full-system response through the sampling probe, tubing, and gas conditioning equipment.
For industrial engineers, verifying response time is therefore both an instrument performance test and a sampling-system evaluation.
What Does Response Time Mean in Industrial Gas Analysis?
Response time describes how quickly a gas analyzer or measurement system reacts to a change in gas concentration. It usually refers to the interval between an abrupt change in the input concentration and the time when the output reaches a specified portion of that change. However, response time is not the same as measurement accuracy, data refresh rate, or warm-up time.
What Is T90 Response Time?
T90 is the time required for a gas analyzer to reach 90% of a defined concentration change. For an upscale step, engineers can calculate the 90% response threshold using:
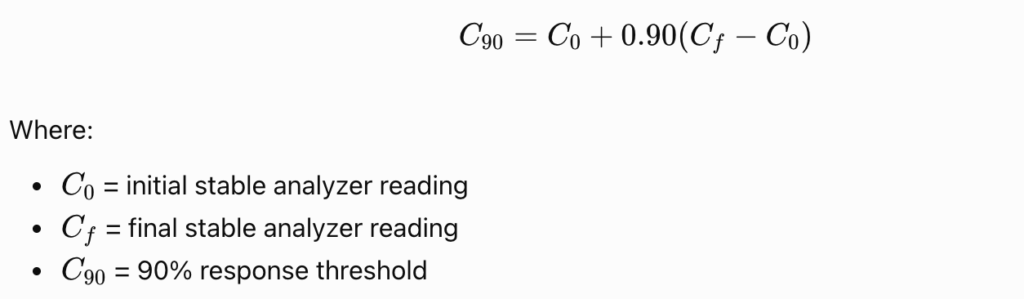
Suppose a CO analyzer initially reads 0 ppm and then receives a 100 ppm calibration gas. The T90 threshold is:

If the gas analyzer reaches 90 ppm after 12 seconds, its observed upscale T90 is approximately 12 seconds. This simplified calculation assumes the output starts at the initial steady value and reaches the expected final concentration. In practice, engineers should use the actual stabilized readings and test-method definitions.
What Is the Difference Between T90 and T95?
T90 and T95 use different endpoints. As a result, their values should not be compared directly.
| Parameter | Definition | Example for a 0–100 ppm step |
|---|---|---|
| T50 | Time to reach 50% of the change | 50 ppm |
| T90 | Time to reach 90% of the change | 90 ppm |
| T95 | Time to reach 95% of the change | 95 ppm |
| Stabilization time | Time to reach and remain within a specified stability band | Depends on the defined tolerance |
For an ideal first-order response, T95 takes longer than T90. Some regulatory procedures require a 95% response rather than T90. For example, certain U.S. EPA performance specifications evaluate the entire monitoring system at the 95% response level. Therefore, engineers should always identify the response threshold and applicable test method before evaluating a manufacturer’s specification.
How Can You Perform a Gas Analyzer T90 Response-Time Test?
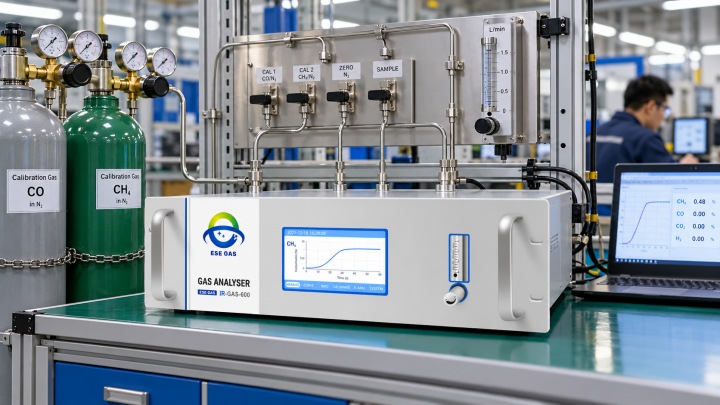
The standard engineering approach uses a controlled step change between zero gas and a certified span gas. The procedure should follow the applicable instrument manual and regulatory test method. The following workflow is suitable for general laboratory or factory performance verification.
Step 1: Prepare the Test Equipment
Before testing, confirm that the gas analyzer has completed its required warm-up and stabilization period. Prepare the following equipment:
- Industrial gas analyzer under test
- Certified zero gas and span calibration gas
- Suitable regulators, valves, and gas tubing
- Flowmeter or mass flow controller
- Data acquisition equipment
- Stopwatch or synchronized electronic timestamps
- Safe gas delivery and exhaust arrangements
The span gas should match the target component and measurement range. Its concentration should remain within the analyzer’s specified operating range. For hazardous gases such as CO or H₂S, use approved gas-handling procedures and appropriate ventilation.
Step 2: Establish a Stable Zero Reading
Introduce zero gas at the analyzer inlet using the specified gas flow rate. Allow the output to stabilize. Then record the initial reading, sampling flow, gas pressure, ambient conditions, and analyzer configuration. Avoid adjusting zero or span during the response measurement itself. This baseline provides the starting concentration for the test.
Step 3: Apply a Rapid Concentration Change
Switch the gas supply from zero gas to span gas. Record the precise switching time as t0. The switching arrangement should minimize dead volume, mixing, and pressure fluctuations. Otherwise, the gas delivery equipment may slow the concentration change before it reaches the analyzer. A properly designed switching valve can improve test repeatability.
Step 4: Record the Upscale T90
Monitor the analyzer output as the measured concentration rises. Identify the time when the reading reaches 90% of the change between its initial and final stable values. For example, with a 0–100 ppm step, an analyzer reaching 90 ppm after 12 seconds has an observed T90 of 12 seconds. However, the value is valid only for the stated test conditions and measurement boundary.
Step 5: Measure the Downscale Response
Switch the input from span gas back to zero gas. For a falling concentration, calculate:

Here, C0 represents the initial high concentration and Cf the final low concentration. For a 100 ppm to 0 ppm step, the 90%-completed downscale threshold is 10 ppm. Record the time required to reach this concentration. The upscale and downscale results may differ because of gas adsorption, sensor dynamics, internal filtering, or sampling conditions.
Step 6: Repeat and Evaluate the Results
Repeat the test according to the applicable protocol, commonly using three trials. Calculate the mean response time and compare it with the required specification. For a general three-trial average:
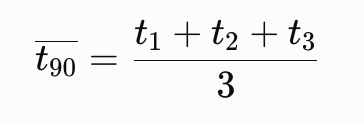
Do not automatically average the upscale and downscale times together. Some standards require separate means and use the slower direction. For example, EPA Method 7E requires three response-time sequences in its prescribed procedure.
The final test report should document individual readings, the mean results, the test conditions, and any applicable acceptance criteria.
What Do Industrial Response-Time Standards Require?
Different standards use different response thresholds, test locations, and acceptance procedures. Engineers should identify the relevant standard before selecting a test method.
| Standard or method | Relevant requirement | Application |
|---|---|---|
| EN 15267-3:2023 | Defines response time using the 90% criterion | Stationary emissions AMS performance |
| EN 15267-4:2023 | Provides response-time requirements for portable AMS | Portable emissions measurement |
| U.S. EPA Performance Specification 2 | Includes complete-system response verification using 95% response criteria | Applicable SO₂ and NOx CEMS |
| U.S. EPA Method 7E | Includes response-time testing and repeat measurements | Instrumental NOx emissions measurement |
| UK Environment Agency TGN M22 | Describes FTIR performance checks, including response time | FTIR stack gas monitoring |
These methods are not interchangeable. Their requirements apply only within their respective scopes. For example, EN 15267-3 addresses automated measuring systems for stationary emissions. Its response-time definition does not establish a universal pass/fail limit for every industrial process analyzer.
Similarly, a T90 value cannot demonstrate compliance with a test requiring T95. A reliable verification report should name the standard edition, measurement threshold, gas injection location, and acceptance criteria.
How Do Different Gas Analyzer Technologies Affect Response Time?
Different sensor technologies react to gas changes through different physical mechanisms. However, the measurement principle alone does not determine system response speed.
Technology | Main response factors | Typical verification concern |
|---|---|---|
| NDIR | Gas-cell exchange, optical detection, signal filtering | Sample flow and cell volume |
| TDLAS | Optical measurement, gas transport, signal processing | In-situ versus extractive configuration |
| UV-DOAS | Optical chamber exchange and spectral processing | Sample delivery and conditioning |
| FTIR | Gas-cell exchange, spectral acquisition, averaging | Sampling and software averaging |
| Electrochemical | Gas diffusion and electrode reaction | Sensor dynamics and aging |
| TCD | Gas exchange and thermal detection | Flow and gas composition |
Can TDLAS Respond Faster Than Extractive NDIR?
An in-situ TDLAS system can avoid extractive sample transport. Therefore, it may respond faster to certain process changes. However, not every TDLAS instrument uses an in-situ arrangement. Extractive laser analyzers also experience sample transport delays.
Similarly, a compact NDIR analyzer can respond rapidly when its sample cell receives a controlled gas flow. The correct comparison should use measured full-system response under equivalent conditions.
Why Can FTIR Response Time Be Longer Than Optical Detection Time?
FTIR instruments acquire and process infrared spectral information to determine gas concentrations. Spectral averaging can improve measurement precision. However, averaging settings may also increase output delay.
In addition, multi-pass gas cells and heated sampling systems require time to exchange the sampled gas. Therefore, engineers should record the acquisition settings, averaging interval, flow rate, and gas-cell temperature during response-time testing.
Why Might a Gas Analyzer Fail a Response-Time Test?
When response time exceeds expectations, the cause may involve the analyzer, the sampling system, or the test arrangement.
| Observed problem | Possible cause | Recommended check |
|---|---|---|
| Slow rise and fall | Low flow, large dead volume, software averaging | Measure flow, inspect tubing, check filtering |
| Fast rise but slow recovery | Adsorption or residual gas | Inspect surfaces, purge and repeat |
| Direct test passes, full-path test fails | Sampling delay, restrictions, gas losses | Inspect probe, filters, lines, conditioning |
| Unstable final reading | Leakage, unstable gas delivery, instrument drift | Perform leak and calibration checks |
| Response differs between gas channels | Sensor characteristics, individual settings | Verify each channel separately |
| Display responds faster than DCS | Output filtering or communication delay | Compare timestamped data sources |
Engineers should investigate these issues before changing calibration coefficients. Calibration adjusts measurement response against known concentrations. It does not automatically correct a physical sampling delay.
Frequently Asked Questions About Gas Analyzer Response Time
Is T90 the Same as Gas Analyzer Response Speed?
T90 is a defined response-time metric. It measures the time required to reach 90% of a concentration change. General terms such as “fast response” do not establish a measurable performance criterion.
How Often Should Response Time Be Verified?
Verification frequency depends on the application, applicable standards, manufacturer instructions, and maintenance history. Additional testing may be necessary after changing sampling pumps, tubing, filters, gas conditioning equipment, or signal-processing settings.
Can a Gas Analyzer Have Good Accuracy but Slow Response?
Yes. Accuracy describes agreement with a reference concentration under specified conditions. Response time describes how quickly the reading changes. An analyzer may pass calibration after stabilization but respond too slowly for process control.
Does Increasing Sampling Flow Always Improve T90?
No. Higher flow may reduce sample transport and gas-cell exchange times. However, excessive flow can exceed instrument specifications, create pressure changes, or affect measurement stability. Always remain within approved operating limits.
Should Engineers Measure T90 at the Analyzer Inlet or Sampling Probe?
Both measurements can be valuable. Analyzer-inlet testing evaluates instrument response under the specified test arrangement. Probe-level testing evaluates the integrated sampling and analysis system. Use the injection point required by the applicable procedure.
Conclusion
Verifying industrial gas analyzer response time requires more than checking a manufacturer’s T90 specification. A proper test introduces a controlled concentration step, records the analyzer output, and calculates the response at the required threshold. Engineers should also examine the slower response direction and repeat measurements under documented conditions.
For extractive systems, full-path verification is especially important because sampling and conditioning equipment can introduce additional delays. ESEGAS provides NDIR, UV-DOAS, TDLAS, and FTIR gas analysis solutions for various industrial monitoring requirements.
Need to verify gas analyzer response time for your application? Contact ESEGAS to discuss instrument selection, calibration testing, sampling-system design, and response-time requirements for your project.