

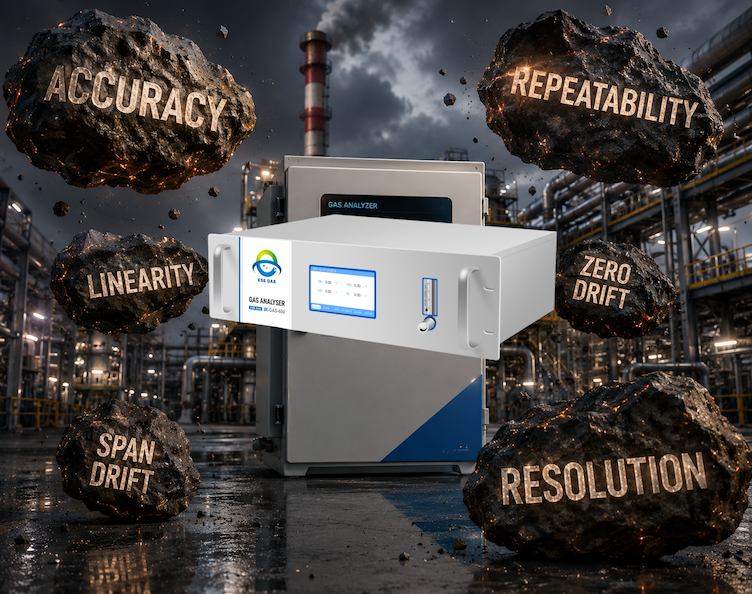
A gas analyser may look impressive on a brochure, but real industrial performance depends on technical specifications, not advertising language. Unstable gas data can lead to combustion inefficiency, safety incidents, failed emissions reporting, and costly downtime. That is why experienced engineers focus on measurable parameters such as accuracy, response time, drift stability, detection range, and cross-interference resistance instead of generic claims like “high precision” or “advanced performance.”
This article explains the technical specifications that truly define a high-performance gas analyser. You will learn how to evaluate analyser specifications like an engineer, how different sensing technologies affect performance, and how to match analyser capabilities to real industrial applications instead of relying on marketing terminology alone.
Why Is Accuracy the First Specification Engineers Check in a Gas Analyser?
When engineers compare a gas analyser, accuracy is usually the first number they examine. It directly affects process control, emissions compliance, product quality, and plant safety. Still, many specification sheets present accuracy in different ways, which can easily cause confusion during equipment selection.
Accuracy Meaning
Not all accuracy specifications describe performance the same way. In industrial gas analysis, manufacturers commonly use three formats:
- Absolute accuracy — shows the maximum deviation from the true gas concentration.
- Full-scale accuracy (FS) — calculates error based on the analyser’s full measurement range.
- Percentage of reading — calculates error from the actual measured value.
For example, a ±1% FS analyser with a 0–1000 ppm range may have an error of ±10 ppm anywhere in the range. Meanwhile, ±1% of reading at 100 ppm only creates a ±1 ppm deviation. That difference becomes critical in trace gas monitoring and ultra-low emission applications.
Accuracy Level for Each Industry
Different industries require very different gas analyser performance targets.
| Industry | Typical Accuracy Requirement |
|---|---|
| Emissions monitoring | High compliance accuracy with low drift |
| Process combustion | Fast and stable oxygen measurement |
| Semiconductor manufacturing | Ultra-trace ppm or ppb precision |
| Biogas upgrading | Stable long-term repeatability |
| Refinery processes | Strong cross-interference resistance |
| Carbon capture systems | High sensitivity at low concentrations |
For example, semiconductor gas analysis focuses heavily on trace contamination detection, while combustion optimization values response speed and stability more than ultra-low detection limits.
Specification sheets may also include: repeatability, linearity, zero drift, span drift, and resolution. These parameters together determine whether the analyser delivers reliable long-term measurements instead of temporary laboratory-level precision.
Why Is Repeatability a Critical Performance Indicator in a Gas Analyser?
Accuracy tells you how close a gas analyser gets to the true value. Repeatability answers a different question: if the gas concentration does not change, will the gas analyser produce nearly the same result every time?
In continuous industrial monitoring, repeatability directly affects process confidence. Operators rely on stable measurement signals to adjust combustion, optimize gas treatment, and maintain environmental compliance. If readings fluctuate without any actual process change, even a highly accurate analyser becomes difficult to trust. Measurement standards commonly define repeatability as the closeness of repeated measurements under the same conditions using the same instrument over a short period of time.
Repeatability Meaning
Repeatability describes an analyser’s ability to deliver consistent results when measuring the same gas sample multiple times under unchanged conditions.
To evaluate repeatability, engineers normally keep these factors constant:
- Same gas concentration
- Same analyser
- Same operator
- Same environmental conditions
- Same measurement procedure
If the measured values remain tightly grouped, repeatability is considered good.
Repeatability is different from accuracy. Accuracy means how close the reading is to the true concentration. Repeatability means how consistent repeated readings remain. A gas analyser may show excellent accuracy after calibration but still have poor repeatability if signal noise, optical instability, or sample variation causes readings to fluctuate.
Repeatability Example
Imagine a flue gas monitoring system measuring CO concentration at 500 ppm.
The analyser performs five consecutive measurements under identical conditions.
Case 1: High Repeatability
| Measurement | CO Reading (ppm) |
|---|---|
| Test 1 | 501 |
| Test 2 | 499 |
| Test 3 | 500 |
| Test 4 | 502 |
| Test 5 | 500 |
| Average = 500.4 ppm; Spread = Very small | |
Result: The readings remain tightly clustered. Operators can confidently use this data for combustion adjustment and emissions reporting.
Case 2: Poor Repeatability
| Measurement | CO Reading (ppm) |
|---|---|
| Test 1 | 488 |
| Test 2 | 514 |
| Test 3 | 497 |
| Test 4 | 522 |
| Test 5 | 481 |
| Average = 500.4 ppm;Spread = Large | |
At first glance, both analysers show the same average value. But the second analyser creates unstable control signals. In real plants, poor repeatability can lead to: burner over-adjustment, false process alarms, unnecessary calibration checks, unstable emissions trends, and reduced operator confidence.
This example highlights an important reality: repeatability determines whether measurement data can be used consistently, not just whether it looks correct once.
Why Does Linearity Matter in a Gas Analyser?
When engineers evaluate a gas analyser, they often focus on accuracy, repeatability, and response time. Yet another parameter quietly determines whether those numbers remain trustworthy across the entire measurement range: linearity.
Linearity answers a simple but important question: When gas concentration changes, does the analyser output change proportionally? A highly linear gas analyser responds consistently from low concentration to high concentration. If concentration doubles, the measured value should increase in the same predictable way. Regulatory verification standards describe linearity as how closely measured values agree with known reference values across the intended operating range.
Linearity Meaning
Linearity measures how closely an analyser follows an ideal measurement curve throughout its full operating range. In practice, engineers verify linearity by introducing multiple certified gas concentrations and comparing the analyser readings with the reference values. A linear analyser produces results that remain proportional across all test points rather than becoming compressed or exaggerated at certain concentrations.
Think of it this way:
- If actual gas concentration increases by 10%
- The analyser reading should increase by approximately 10%
- Not 6%, not 15%
Poor linearity usually becomes more visible near the upper or lower ends of the measurement range.
Common causes include: detector saturation, optical nonlinearity, sample conditioning effects, electronic signal distortion, cross-gas interference, and incorrect calibration range selection. A gas analyser with strong linearity allows operators to trust measurements equally at low load and full production conditions.
Linearity Example
Imagine a gas analyser measuring CO concentration with a measurement range of 0–1000 ppm. Engineers introduce certified calibration gases.
| Actual CO Concentration (ppm) | Analyser A Reading (ppm) | Analyser B Reading (ppm) |
|---|---|---|
| 100 | 101 | 98 |
| 300 | 301 | 288 |
| 500 | 501 | 462 |
| 700 | 698 | 620 |
| 900 | 902 | 760 |
Analyser A — Good Linearity
Measured values closely follow actual concentrations across the full range.
Analyser B — Poor Linearity
Error becomes larger as concentration increases.
At 100 ppm, the error appears small. At 900 ppm, the analyser underreports by 140 ppm. This creates real operational problems: combustion systems may receive incorrect control signals, emissions reporting may become unreliable, gas treatment efficiency may appear better than reality, and process optimization decisions may drift over time.
Notice that poor linearity does not always mean poor accuracy at one calibration point. An analyser can appear accurate during calibration and still generate large errors elsewhere in the range.
Why Is Drift One of the Most Important Long-Term Performance Indicators in a Gas Analyser?
A gas analyser may deliver excellent results on the first day of installation and still become unreliable months later. The reason is often not accuracy loss—it is drift.
Drift refers to a gradual change in analyser output even when the actual gas concentration remains unchanged. Unlike random noise, drift moves measurement results in one direction over time, making it difficult to notice until process data begins to look inconsistent.
Drift Meaning
Drift describes the change in measurement output caused by the analyser itself rather than by a real change in gas concentration. A stable gas analyser should produce nearly identical readings under unchanged conditions. When readings slowly move higher or lower over time, drift occurs. Regulatory testing standards treat drift as a separate performance characteristic because excessive drift can invalidate measurement results and require correction.
Two common forms appear in industrial gas analysers:
Zero Drift
Zero drift happens when the baseline moves away from true zero.
Example:
Actual gas concentration = 0 ppm CO
Initial analyser reading = 0 ppm CO
After continuous operation = 6 ppm CO
The gas did not change, but the CO analyser baseline changed. Zero-response drift is commonly evaluated over a defined operating period to verify CO analyser stability.
Span Drift
Span drift occurs when CO analyser sensitivity changes across the measurement range.
Example:
Calibration gas = 1000 ppm CO
Initial reading = 1000 ppm CO
One month later = 960 ppm CO
Although concentration stays constant, measurement output shifts because CO analyser gain changes. Span drift often appears due to temperature variation, optical aging, contamination, pressure fluctuation, or sensor degradation.
Drift Example
Imagine a continuous flue gas monitoring system measuring CO at a stable concentration of 500 ppm. Operators record data over six weeks without recalibration.
| Operating Time | Actual CO (ppm) | Analyser Reading (ppm) |
|---|---|---|
| Week 1 | 500 | 500 |
| Week 2 | 500 | 504 |
| Week 3 | 500 | 510 |
| Week 4 | 500 | 517 |
| Week 5 | 500 | 524 |
| Week 6 | 500 | 532 |
At first, the change looks small. By Week 6, the analyser reports a value 32 ppm higher than reality. That error can trigger a chain reaction. For example, combustion systems may reduce fuel unnecessarily; emissions reports may overstate pollutant levels; process optimization models receive biased data; maintenance teams may investigate non-existent process changes.
Now consider another scenario. A laser-based gas analyser with improved optical stability records: 500 → 501 → 500 → 499 → 501 → 500 ppm. The process appears unchanged because the measurement remains stable. This is why long-term stability often creates more value than extreme initial precision. A gas analyser that drifts less requires fewer calibrations, produces more reliable process trends, and reduces operating cost across its lifecycle.
Why Does Resolution Matter in a Gas Analyser?
When two gas concentrations are very close to each other, not every gas analyser can tell the difference. That capability depends on resolution. Resolution defines the smallest change in gas concentration that the analyser can detect and display as a measurable difference. In simple terms, it determines how fine the measurement output can be. Resolution is generally understood as the minimum distinguishable change in a measured parameter rather than overall measurement correctness.
Good resolution allows engineers to see small process movements earlier and respond faster. However, high resolution does not automatically mean high accuracy.
Resolution Meaning
Resolution describes the smallest concentration increment that appears as a change in the analyser output.
For example:
Resolution = 1 ppm
→ readings change in steps of 1 ppm
→ possible output: 100 ppm → 101 ppm → 102 ppm
Resolution = 0.1 ppm
→ readings change in smaller increments
→ possible output: 100.0 → 100.1 → 100.2 ppm
A higher-resolution gas analyser can distinguish smaller concentration changes.
This parameter is particularly valuable when process conditions change gradually rather than dramatically.
It is also important not to confuse three commonly mixed specifications:
Resolution → smallest visible concentration change
Accuracy → closeness to the true value
Repeatability → consistency of repeated measurements
Industrial measurement standards emphasize that resolution alone does not guarantee usable data quality; it must work together with analyser accuracy and noise performance.
Another practical point: excessively high resolution does not always improve measurement quality. If the process itself is noisy, adding more display digits may create the illusion of precision without increasing real measurement capability. Similar principles are recognized in analytical instrumentation, where practical resolving performance matters more than theoretical display granularity.
Resolution Example
Imagine a gas analyser measuring CO concentration near a process target of 100 ppm.
The actual process slowly changes.
Case 1: Resolution = 5 ppm
| Actual CO (ppm) | Analyser Reading (ppm) |
|---|---|
| 100.2 | 100 |
| 101.7 | 100 |
| 103.1 | 105 |
| 104.6 | 105 |
| 106.0 | 105 |
Result: small concentration changes disappear. Operators only notice changes after several ppm accumulate.
Case 2: Resolution = 0.5 ppm
| Actual CO (ppm) | Analyser Reading (ppm) |
|---|---|
| 100.2 | 100.0 |
| 101.7 | 101.5 |
| 103.1 | 103.0 |
| 104.6 | 104.5 |
| 106.0 | 106.0 |
Result: the analyser captures gradual process variation much earlier.
This difference becomes critical in real operation. The key is balance. The best gas analyser is not the one with the smallest displayed increment—it is the one whose resolution matches the actual process requirement while maintaining accuracy, stability, and low noise.
Conclusion
The best gas analyser is not necessarily the one with the highest published accuracy or the longest feature list. It is the one that produces stable, repeatable, and actionable measurement data throughout the full lifecycle of the process.
When evaluating a gas analyser, focus on the specifications that directly influence real operation:
- Accuracy → Can the measurement reflect reality?
- Repeatability → Can it reproduce the same result consistently?
- Linearity → Does performance remain reliable across the full range?
- Drift → Will measurements remain trustworthy over time?
- Resolution → Can meaningful process changes be detected early?
Choose specifications that match the process environment—not just the datasheet.
FAQs:
1. What are the most important specifications to evaluate in a gas analyser?
The most important specifications include accuracy, repeatability, linearity, drift, resolution, response time, and long-term stability. Together, these parameters determine whether the gas analyser can provide reliable data under real industrial operating conditions rather than only during factory calibration. Regulatory measurement frameworks also treat these characteristics as independent verification items because each affects overall measurement quality differently.
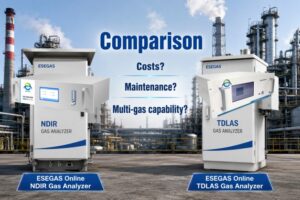
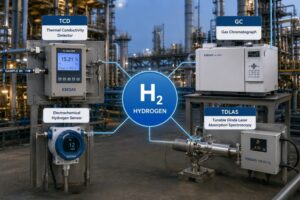
2. Which gas analysis technology provides the best measurement stability?
The gas analysis best technology depends on the application. In many industrial environments:
- NDIR performs well for stable CO, CO₂, and CH₄ measurement
- TDLAS provides strong selectivity, fast response, and low drift
- UV-DOAS handles complex flue gas analysis effectively
- Paramagnetic analysers deliver stable oxygen measurement
Technology selection should match process conditions rather than focusing on one specification alone.
3. Why does long-term stability often matter more than initial accuracy?
A gas analyser may show excellent laboratory accuracy but lose reliability if readings drift during operation. Stable analysers reduce recalibration frequency, minimize downtime, and provide more dependable process trends over months or years of operation. Standards therefore evaluate stability, drift, and repeatability separately instead of relying only on initial calibration performance.