

Many VOC gas analyzers claim high accuracy, excellent stability, and low maintenance. However, most datasheets only provide a few specifications without showing real test data. Instead, it comes from repeatability tests, interference evaluations, and long-term stability verification.
This article analyzes an actual VOC Gas Analyzer test report and explains what the numbers mean.
What Does This VOC Gas Analyzer Test Report Actually Show?
The test was conducted under controlled laboratory conditions:
| Ambient Temperature (15-35℃) | 21.8°C | |||||
| Relative Humidity (85%) | 54% | |||||
| Pressure Value (KPa) | THC | CH4 | C6H6 | Back Blowing | H2 | Air |
| 296.14 | – | – | 295.67 | 76.05 | 80.84 | |
| Calibration Gas Concentration (mg/m3) | C2H6 | C3H8 | SiF4 | |||
| 101 | 100 | 5% | ||||
| Test Results | |||||||
| THC Retention Time (min) | 0.362 | 0.362 | 0.362 | 0.361 | 0.361 | 0.362 | 0.362 |
| THC Peak Area (μV*s) | 7481550 | 7480980 | 7481736 | 7481386 | 7480977 | 7481936 | 7481857 |
| THC Test Results (mg/m3) | 200.96 | 200.94 | 200.90 | 200.96 | 200.94 | 200.97 | 200.97 |
| C2H6 Retention Time (min) | 1.966 | 1.967 | 1.967 | 1.966 | 1.967 | 1.966 | 1.966 |
| C2H6 Peak Area (μV*s) | 3579317 | 3578987 | 3578764 | 3579038 | 3579467 | 3579138 | 3579048 |
| C2H6 Test Results (mg/m3) | 100.29 | 100.28 | 100.27 | 100.28 | 100.27 | 100.28 | 100.28 |
| C3H8 Retention Time (min) | 4.897 | 4.898 | 4.896 | 4.896 | 4.895 | 4.897 | 4.893 |
| C3H8 Peak Area (μV*s) | 5440242 | 5441028 | 5439549 | 5440655 | 5443968 | 5440304 | 5440917 |
| C3H8 Test Results (mg/m3) | 100.72 | 100.73 | 100.71 | 100.73 | 100.789 | 100.72 | 100.73 |
Cross-interference resistance
The test report evaluated VOC gas analyzer performance under several different background gas conditions. These included: Hydrogen (H₂), Air, Back-blowing gas, and SiF₄-related conditions.
Despite these changing backgrounds, the measured VOC concentrations remained nearly unchanged. This demonstrates that the gas analyzer can distinguish target VOC compounds from surrounding gas components without introducing significant measurement error.
In practical terms, operators can trust the analyzer even when process conditions fluctuate.
Measurement repeatability
When evaluating a VOC Gas Analyzer, consistency often matters more than a single high-accuracy reading. In industrial monitoring, operators need confidence that the gas analyzer will provide the same result every time it measures the same gas.
That is why Relative Standard Deviation (RSD) is one of the most important indicators. Retention Time RSD measures how consistently the gas analyzer reproduces that retention time across repeated runs. Peak Area RSD measures how consistently the gas analyzer reproduces the same peak area during repeated measurements.
| Inspect Item | Specification Requirement | Indicated Value (Accuracy 0.001) | ||||
| THC: Relative Standard Deviation (RSD) | Qualitative | Retention Time RSD≤1% | 0.135 | |||
| Quantitative | Peak Area RSD≤2% | 0.005 | ||||
| C2H6: Relative Standard Deviation (RSD) | Qualitative | Retention Time RSD≤1% | 0.027 | |||
| Quantitative | Peak Area RSD≤2% | 0.006 | ||||
| C3H8: Relative Standard Deviation (RSD) | Qualitative | Retention Time RSD≤1% | 0.033 | |||
| Quantitative | Peak Area RSD≤2% | 0.026 | ||||
| Channel 1 | 24h Zero Drift | ≤±3% F.S. | 0 | 0 | 0 | |
| 30min Baseline Noise | ≤2mv | 0.48 | ||||
Taken together, the THC, C₂H₆, and C₃H₈ results confirm that the VOC gas analyzer can repeatedly produce highly consistent measurements.
Long-term stability
Many users focus on initial accuracy. However, long-term operation often tells a different story. A VOC gas analyzer may perform well after calibration but gradually drift over time. According to the test report, the VOC gas analyzer achieved no measurable drift during the evaluation period. A low-drift analyzer offers several advantages:
- Better data credibility
- Reduced calibration frequency
- Lower maintenance requirements
- Improved regulatory compliance
- Lower total cost of ownership
For continuous emission monitoring, long-term stability is often more valuable than a small improvement in laboratory accuracy.
How Does the ESEGAS VOC Gas Analyzer Achieve Such Stable Results?

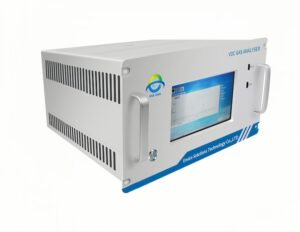
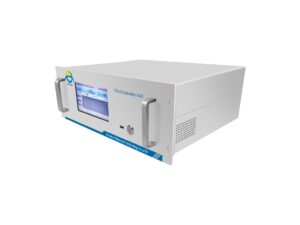
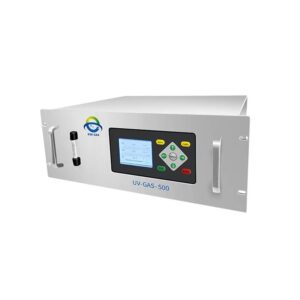
The ESEGAS VOC Gas Analyzer combines a compact gas chromatograph with a valve assembly, gas path control system, detector (FID-Based), and computer control system. Its flexible design supports different detector and gas path configurations to meet various VOC monitoring requirements. The platform utilizes Gas Chromatography coupled with Flame Ionization Detection (GC-FID), a widely adopted technology for accurate VOC measurement in complex gas streams.
High-Sensitivity FID Detection
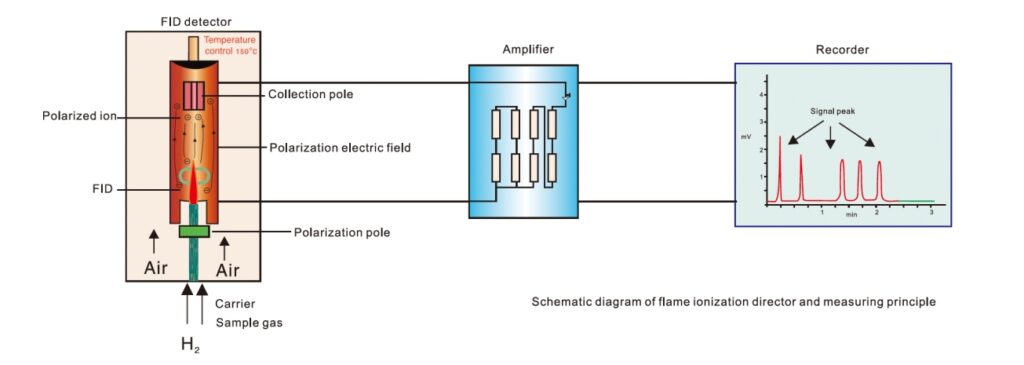
The analyzer uses a Hydrogen Flame Ionization Detector (FID), which offers high sensitivity, responds to nearly all organic compounds, and delivers excellent robustness. This helps ensure accurate and repeatable VOC measurements.
Reliable Pneumatic Control
The pneumatic control system is based on fully physical valve control, providing a long service life, high stability, and a low failure rate. Stable gas flow contributes directly to consistent retention times and reliable analytical performance.
Intelligent Temperature Control
An integrated computer control system combines industrial microprocessor technology with dedicated chromatography software. It precisely controls the temperatures of the valve assembly and detector, ensuring safe operation, reliable performance, and excellent measurement repeatability.
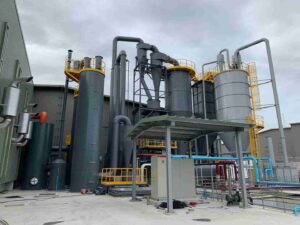
Which Industries Benefit Most from High-Precision VOC Gas Analyzers?
Industries with strict environmental requirements often need more than simple VOC screening. High-performance VOC Gas Analyzers provide measurable value in:
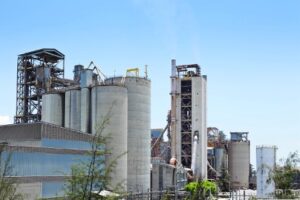
- Petrochemical Plants: Monitoring hydrocarbon emissions and process leaks.
- Chemical Manufacturing: Tracking solvent emissions and process efficiency.
- Semiconductor Production: Managing highly sensitive exhaust streams with complex gas compositions.
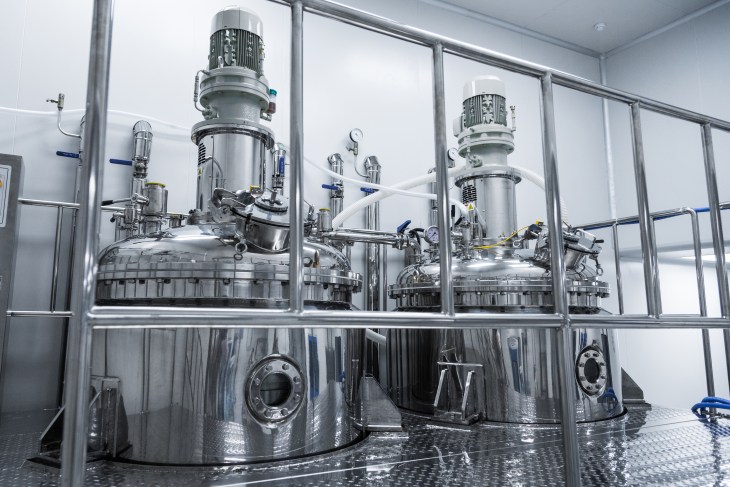
- Pharmaceutical Facilities: Controlling solvent recovery systems and environmental emissions.
- Coating and Printing Operations: Monitoring VOC release from paints, inks, and organic solvents.
In all of these applications, reliable data supports both environmental compliance and process optimization.
Conclusion: What Can This VOC Gas Analyzer Test Report Teach Us?
This test report demonstrates that a high-quality VOC gas analyzer is not defined by a single accuracy number. Instead, true performance comes from a combination of excellent repeatability, strong interference resistance, minimal zero drift, and long-term operational stability.
The analyzed results show extremely low RSD values, virtually unchanged measurements under different gas backgrounds, and zero measurable drift over 24 hours. For industrial VOC monitoring, these characteristics are often the difference between data you hope is correct and data you can confidently trust. When selecting a VOC Gas Analyzer, always ask for the test report behind the specifications. The numbers usually tell a much clearer story than the marketing brochure.
If you need a VOC gas analyzer for your VOC monitoring system, contact with us please!
FAQs:
Q: Does the Supplier Provide Repeatability Data?
A: Look for retention time and concentration repeatability results.
Q: Has Interference Testing Been Performed?
A: Verify performance under different background gas conditions.
Q: What Is the Long-Term Drift Performance?
A: Low drift reduces maintenance and improves reliability.
Q: Which Detection Technology Is Used?
A: GC-FID generally offers stronger selectivity and repeatability than many basic VOC sensor technologies.
Q: Can the System Operate Continuously?
A: Industrial applications require stable operation under changing process conditions.
Q: Is There Real Test Evidence?
A: A detailed performance report often reveals more than a specification sheet.