



Wastewater plants are increasingly expected to reduce their climate impact, but electricity consumption tells only part of the story. Biological treatment, sludge processing and biogas handling can release gases whose climate effect is easily underestimated. Without representative data, operators may invest in energy efficiency while missing emissions generated directly by the treatment process.
The revised EU Urban Wastewater Treatment Directive requires competent authorities or appropriate bodies to monitor at least CO₂, N₂O and CH₄ from plants treating 10,000 population equivalent or more, using analysis, calculations or modelling where appropriate. A reliable program should combine plant-level accounting with targeted measurements at major emission sources.

pic source:ABC Education
The directive does not state that every plant must immediately install the same continuous analyzer. Operators therefore need a proportionate strategy that identifies important sources, selects suitable measurement methods and documents how annual results are calculated.
What Does the Revised EU Directive Require?
Treating the new requirement as a simple instrument-purchasing exercise can lead to incomplete coverage. The regulation concerns total emissions from the treatment plant, so the selected approach must connect measurements or calculations to an annual inventory.
Under Article 21 of Directive (EU) 2024/3019:
- At least CO₂, N₂O and CH₄ must be covered for plants of 10,000 p.e. and above.
- Analysis, calculations or modelling may be used where appropriate.
- The European Commission is expected to establish methodologies for measuring, estimating and modelling emissions by 2 July 2027.
- Member States are expected to establish plant-level datasets with a gas-by-gas breakdown by 31 December 2030.
A plant should therefore distinguish between current technical preparation and the final methodology that will apply under national implementation.
Where Are the Main N₂O and CH₄ Sources?
Monitoring only the final building exhaust can dilute important sources until they become difficult to identify. It may also prevent operators from linking emissions to the process condition that caused them.
Typical aeration basin emissions are associated with biological nitrogen conversion. N₂O formation can change rapidly with dissolved oxygen, nitrite accumulation, ammonia loading, temperature and aeration strategy.
Potential CH₄ sources include:
- Collection systems and inlet works.
- Anaerobic zones.
- Sludge thickeners and storage tanks.
- Digesters and biogas treatment equipment.
- Pressure-relief devices and seals.
- Dewatering operations.
- Dissolved methane released when liquid enters an aerated or turbulent stage.
The importance of each source varies between plants, so a screening survey is usually needed before permanent instruments are positioned.
Should Plants Measure, Calculate or Model Their Emissions?
Using only generic factors may hide site-specific performance, while attempting to measure every possible source can make a program expensive and difficult to maintain. A tiered approach provides a more practical balance.
A plant can combine three methods:
- Calculation: Use activity data and recognised emission factors for preliminary reporting.
- Modelling: Estimate emissions from process variables, loading and treatment configuration.
- Direct measurement: Measure important or highly variable sources to improve accuracy and support emission-factor validation.
Direct measurement is most valuable where emissions are large, unstable or sensitive to operating changes. Calculations may remain appropriate for smaller sources if the assumptions are documented and periodically reviewed.
Where Should Gas Measurements Be Taken?
Installing an analyzer at a convenient location does not guarantee representative results. Gas may disperse unevenly across open tanks, move through several ventilation systems or remain dissolved in the water.
Possible monitoring points include:
| Process area | Measurement approach |
|---|---|
| Aeration tanks | Floating hood or controlled off-gas collection |
| Enclosed process tanks | Ventilation or process exhaust sampling |
| Digesters and biogas systems | Process gas and vent monitoring |
| Sludge treatment | Local extraction and sludge-line emissions assessment |
| Inlet works | Targeted screening of enclosed headspaces |
| Final site boundary | Supporting checks rather than sole source quantification |
For an off-gas measurement to produce an emission rate, concentration data must normally be combined with representative gas flow. Liquid sampling may also be necessary where dissolved gas contributes significantly.
Which Gas Analysis Technologies Are Suitable?
A single measurement technology rarely covers every plant condition. Selecting instruments without considering humidity, range and gas composition can create interference or maintenance problems.
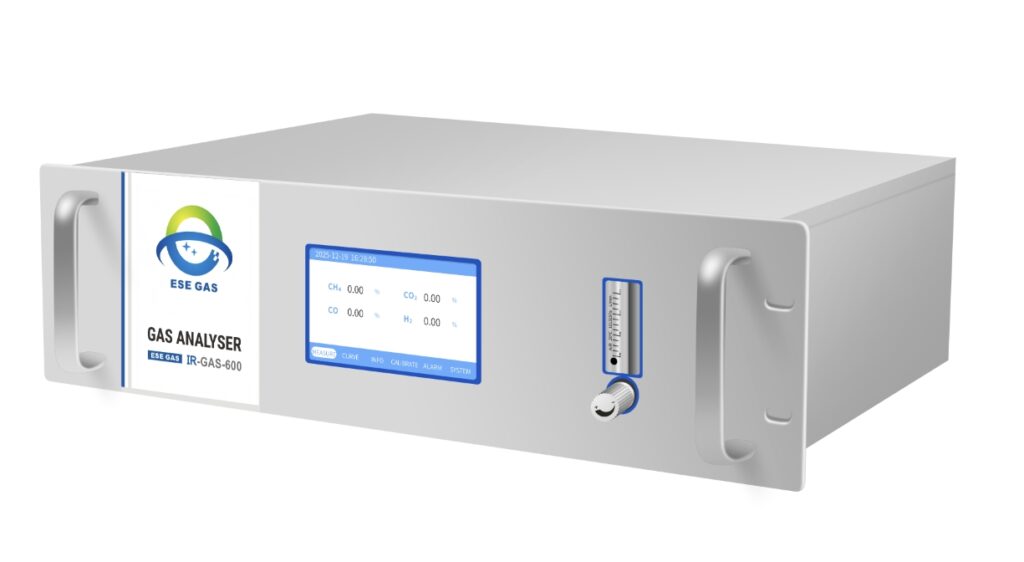
Common options include:
- NDIR analysis: Suitable for continuous measurement of infrared-active gases such as CH₄, CO₂ and, with an appropriate configuration, N₂O.
- FTIR analysis: Useful when several infrared-active components must be measured simultaneously.
- Gas chromatography: Often used for laboratory confirmation or detailed composition analysis.
- Flow measurement: Required when concentrations must be converted into mass-emission rates.
- Liquid-phase methods: Needed to evaluate dissolved gas that is not yet present in the sampled headspace.
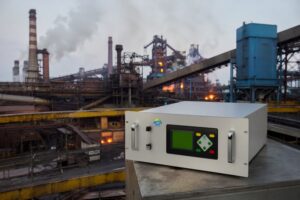
At ESEGAS, we can configure NDIR or FTIR-based measurement around the required gases and ranges, but the analyzer must remain part of a properly designed sampling and flow-measurement system.
How Can Operators Obtain Representative Annual Data?
A short campaign under stable weather and loading conditions may not describe an entire year. Wastewater emissions can vary with rainfall, seasonal temperature, industrial inflow and process-control changes.
A representative program should record:
- Influent flow and nitrogen load.
- Dissolved oxygen and aeration rate.
- Ammonia, nitrate and nitrite concentrations.
- Water and ambient temperature.
- Sludge age and process configuration.
- Biogas production and utilisation.
- Maintenance, bypass and abnormal events.
- Calibration and analyzer status.
Measurements should cover different loads, seasons and operating modes. Zero and span checks, time alignment, moisture management, leak testing and uncertainty assessment should also be documented.
How Should Results Be Reported?
Reporting only a final carbon-dioxide-equivalent value makes it difficult to verify which source or assumption caused a change. A gas-by-gas, source-by-source structure provides much stronger evidence.
A plant-level GHG inventory should identify:
- Direct emissions of each gas.
- The treatment stage or source.
- Whether the result was measured, calculated or modelled.
- Concentration and flow data used in calculations.
- Applied factors and their references.
- Excluded sources and the justification.
- Data gaps and substitution rules.
- Measurement uncertainty.
The revised directive creates a clear reason for wastewater plants to begin preparing now, even while detailed European methodologies continue to develop. At ESEGAS, we recommend starting with source mapping and a targeted measurement campaign, then using the results to build a transparent annual inventory. This provides useful operational insight today and a stronger foundation for future reporting requirements.