

In industrial measurement, gas analyzer accuracy describes how close an analyzer’s reading is to the true gas concentration. It’s not just a label on a datasheet — it tells operators whether they can trust the numbers for compliance and process decisions. In measurement science, this difference between the measured value and the actual (reference) value is called an error. Accuracy reflects both absolute error and relative error. Absolute error is the raw difference between the measured and true value, while relative error expresses this difference as a percentage of the true value. These terms help quantify how far a reading can stray from reality. Understanding them lets you judge whether a measurement is fit for purpose.

In addition to error types, industrial gas analyzers can show zero drift and span error, which affect accuracy over time. Zero drift occurs when the baseline reading shifts away from zero without actual gas present, often due to temperature changes or warm-up effects. Span error refers to deviation in readings across the measurement range, influenced by sampling system issues or component drift. Separating these effects helps you pinpoint where in the measurement chain accuracy changes occur.
It’s also important to distinguish accuracy from precision and repeatability. Precision refers to how close repeated measurements are to each other regardless of how close they are to the true value. A precise analyzer can still be inaccurate if it consistently measures wrong. Repeatability is a similar concept, measuring consistency under unchanged conditions. Understanding these terms helps you interpret analyzer performance holistically.
What Are Common Industrial Gas Analyzer Accuracy Specifications?
Manufacturers describe accuracy in several ways, and the format affects how you interpret specs. Two common formats are % of reading and % of full scale (FS). The “% of reading” spec ties the allowable error to the current measured value. For example, ±2% of reading means the error grows with the actual gas concentration. The “% of FS” spec ties the error to the analyzer’s entire range — for example, ±1% FS means the error is limited as a fraction of the maximum range. Many standards combine both formats, stating accuracy as something like ±2% of reading or ±0.3% FS, whichever is larger. This ensures the spec covers both low and high concentration conditions fairly.
These spec formats matter in real use because they influence how tight tolerances are at different parts of the range. At low concentrations, % of FS specs often dominate and can appear more generous. At higher readings, % of reading specs better reflect actual performance. Knowing how to read these specs helps you compare instruments and set realistic expectations.
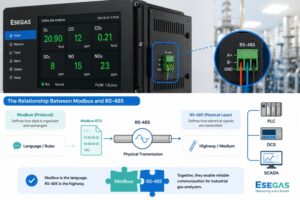
Different measurement technologies also deliver different real-world accuracy. For example, NDIR (non-dispersive infrared) gas analyzers often show good long-term stability and low drift for gases like CO and CO₂. Their accuracy is typically specified in % FS terms with very low drift over weeks. On the other hand, TDL (tunable diode laser) analyzers can offer high precision and fast response, often with low drift over months, making them suitable for trace gas measurement. Understanding these typical ranges can help you choose the right analyzer for your application.
How Can You Quantify Gas Analyzer Accuracy Using Key Formulas?
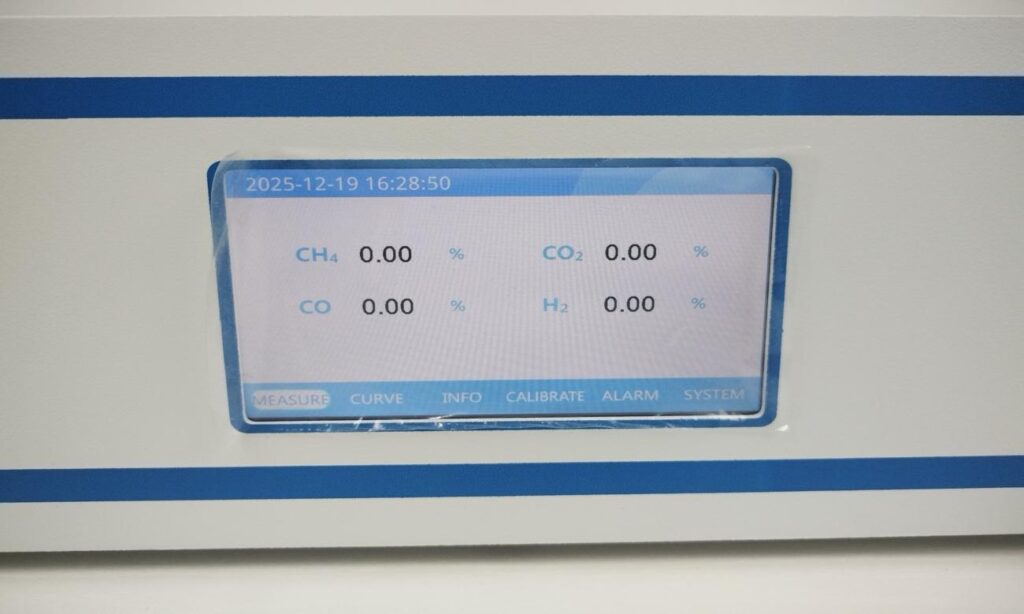
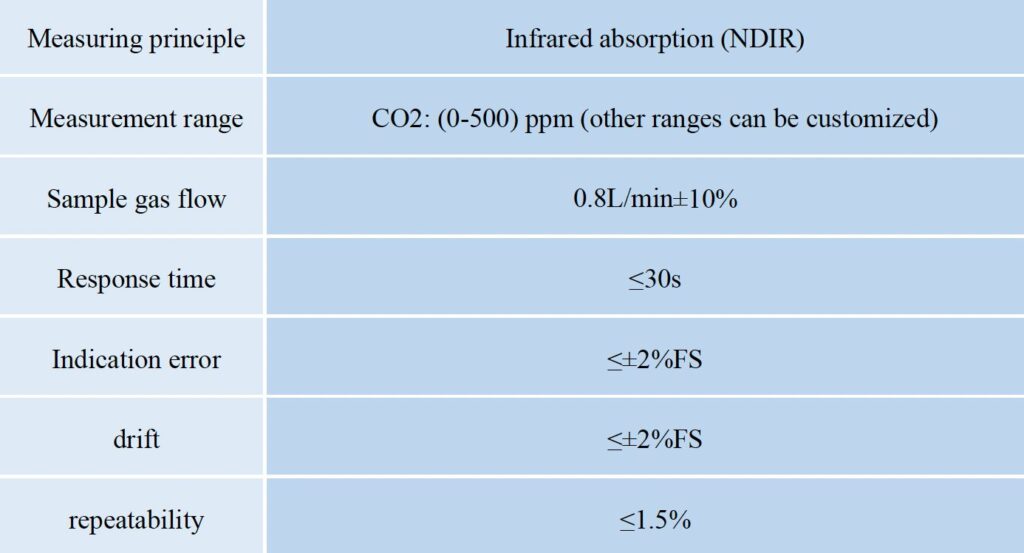
(ESEGAS IR-GAS-600 Gas Analyzer)
When evaluating gas analyzer accuracy, you need clear math to quantify how far a measurement strays from the true value. This section explains the standard formulas used in industrial metrology and shows how to use them in practical calibration contexts. Accuracy is fundamentally the gap between the reported concentration and the real (reference) concentration of gas. Absolute and relative errors are the basic building blocks for any accuracy calculation.
Absolute Error: The Straight Difference
Absolute error is the simplest measure of deviation. You calculate it as the absolute difference between what the analyzer reports and the known reference from a calibrated gas. The formula is:
Absolute Error = |Measured Value − True Value|
For example, if a calibration gas with a certified CO₂ concentration of 1,000 ppm yields a reading of 980 ppm, the absolute error is |980 ppm − 1,000 ppm| = 20 ppm. Absolute error tells you the size of the error in the same units your analyzer reports, which helps in identifying basic instrument bias or drift during calibration.
Relative Error: Putting the Deviation in Context
Absolute error alone doesn’t tell you how significant the error is relative to the actual gas concentration. That’s where relative error (also called percentage error) comes in. It scales the absolute error against the true value to express accuracy as a percent:
Relative Error (%) = (Absolute Error / True Value) × 100%
Using the previous example, Relative Error = (20 ppm / 1,000 ppm) × 100% = 2%. This percentage representation is useful because it shows how large the error is in relation to the true concentration. It’s especially helpful when comparing performance at different concentration levels. Always use the true reference value (e.g., a certified calibration gas) as the denominator for meaningful results.
Accuracy Relative to Full Scale: %FS Explained
Many industrial analyzers define accuracy as a percentage of Full Scale (%FS) instead of a percentage of the reading. Full scale refers to the maximum range the analyzer is designed to measure. The formula for %FS error is:
Error %FS = (Absolute Error / Full Scale Range) × 100%
For example, if an analyzer has a range of 0–10,000 ppm and shows a 50 ppm absolute error at any point in the range, the %FS error = (50 / 10,000) × 100% = 0.5% FS. Expressing error as %FS standardizes accuracy across the entire measurement range. It is common in industrial specifications because it provides a consistent reference when instrument outputs vary.
How Do You Calculate Gas Analyzer Accuracy from Field Data?
In industrial practice, evaluating gas analyzer accuracy from field measurements requires a systematic workflow. This process ensures your analyzer’s performance aligns with its specifications and with regulatory demands. Field data accuracy checks rely on traceable standards and repeatable procedures. The steps below guide you from preparation to interpretation.
Step 1 — Select Calibration Standards
Begin by choosing good reference gas standards with known, certified concentrations. These standards act as your true values for comparison during accuracy checks. Make sure the gas cylinders or mixtures are documented with traceability information and certificate uncertainties. High-quality standards help pinpoint actual instrument error instead of reference gas variation.
Step 2 — Conduct Zero and Span Calibration
Once you have proper reference gases, perform both zero and span calibrations. Zero calibration sets the analyzer’s baseline when no target gas is present, usually using zero gas or clean air. Then apply a span gas with a known concentration at the upper end of the analyzer’s range to adjust scale output. This two-point set-up helps eliminate baseline drift and scale gain error, setting a stable reference across the range.
Step 3 — Measure Known Calibration Points Across Range
After setting baseline and span, measure several calibration points throughout your analyzer’s range. Use reference gases that cover low, mid, and high concentrations relevant to your application. Collect multiple data points, as this helps reveal non-linear response or sensor issues that might not show at a single point. Recording a wide spread of points also strengthens your later accuracy evaluation.
Step 4 — Compute Absolute and Relative Errors
With field readings logged, use the formulas from earlier to compute absolute and relative errors for each calibration point. Compare the measured values directly with the certified reference concentrations to quantify how far the analyzer deviates in each case. This step turns your raw data into accuracy metrics you can report and analyze.
Step 5 — Report and Interpret Accuracy Results
Finally, summarize your results in a clear report. Present ranges of error, and consider a simple histogram or table showing how measurement errors spread across the analyzer’s range. Then compare these results with the manufacturer’s accuracy specifications to see if the analyzer meets requirements for your application. This comparison highlights whether the instrument is fit for purpose or needs recalibration or servicing.
What Does a Practical Gas Analyzer Accuracy Example Look Like?
To make gas analyzer accuracy real, let’s walk through a simple, step-by-step field example using combustion emissions data. This helps you connect the formulas you learned earlier with actual numbers. A combustion emissions analyzer typically measures gases like CO₂, O₂ and CO in boiler or furnace flue gas. These values feed into process control and emissions reporting, so accuracy matters.
Example: Combustion Emissions Analyzer Accuracy Calculation
Imagine you are testing a combustion analyzer that measures CO₂ in flue gas from a boiler. You use a certified calibration gas with a true concentration of 5,000 ppm CO₂. The analyzer reads 4,850 ppm on this point.
Step 1 — Absolute Error:
Absolute error quantifies how far the reading is from the true value.
Absolute Error = |4,850 ppm − 5,000 ppm| = 150 ppm
Step 2 — Relative Error:
Now express that deviation as a percentage of the true value:
Relative Error (%) = (150 ppm / 5,000 ppm) × 100% = 3%
This tells you that at this concentration, the analyzer’s reading is 3% off from the certified gas value.
Step 3 — Error as % of Full Scale:
If your analyzer’s full scale for CO₂ is 10,000 ppm:
Error %FS = (150 ppm / 10,000 ppm) × 100% = 1.5% FS
This means the calibration deviation falls within 1.5% of the maximum measurement range. Because industrial specs often combine both kinds of percentages, technicians can judge whether the instrument meets the required tolerance levels. By working through numbers like this, you can objectively assess whether the analyzer’s performance meets your accuracy needs.
Conclusion
Now it’s time to check your gas analyzer accuracy with ESEGAS team. Start by implementing a regular calibration schedule that uses high-quality reference gases and follows traceable metrology practices. Compare your results against instrument specifications like %FS and % of reading to decide if a gas analyzer meets your accuracy requirements. When errors exceed acceptable limits, investigate sources like sampling system leaks, environmental effects, or sensor age and correct them promptly. Consistent accuracy checks help ensure your process data remain reliable for compliance reporting, process optimization, and safety assurance.
FAQs:
1.What’s the difference between accuracy and precision in gas analyzers?
Accuracy describes how close a gas analyzer’s reading is to the true gas concentration, while precision refers to how consistently the analyzer repeats the same reading under unchanged conditions. In regulatory terms, precision is often defined by statistical variation (e.g., standard deviation across repeated responses), separate from accuracy. An analyzer can be precise (consistent outputs) but still inaccurate if it consistently deviates from the true value.
2.How often should I calibrate my gas analyzer to maintain accuracy?
Calibration intervals depend on the instrument and application. Many industrial analyzers require calibration every 3–6 months under normal conditions, but high-demand or safety-critical environments may need more frequent checks. Some manufacturers also recommend regular validation tests between calibrations to catch drift early.
3.Can calibration gas uncertainty affect accuracy calculation?
Yes. Calibration gas serves as the reference standard when assessing gas analyzer accuracy. If the reference gas has high uncertainty, it directly increases the uncertainty in your accuracy calculation. That’s why certified calibration gases traceable to recognized standards (e.g., NIST) are essential for meaningful results.
4.How do drift and span errors influence accuracy results?
Drift describes changes in an analyzer’s baseline over time, often due to sensor aging or environmental effects. Drift increases error if not corrected by regular calibration. Span error refers to proportional deviations across the measurement range, typically visible when readings are consistently off by a percentage of actual concentration. Both drift and span errors must be identified and corrected through proper calibration to maintain accurate measurements.