Dust particulate matter (PM) in our stacks and ducts carries more than just visible grit. It represents a direct bridge between process performance, regulatory compliance and workplace safety. In the context of a Continuous Emissions Monitoring System (CEMS), a dust monitor provides continuous feedback on particulate load leaving the facility. First, from the compliance angle: many jurisdictions treat dust (and opacity) as regulated emissions, so failing to monitor means risking heavy fines and reputational damage. Second, from the operational efficiency angle: when dust levels rise, this may signal baghouse leakages, filter malfunction, or shifting combustion conditions. Early detection allows corrective action. Third, from the plant safety and health angle: elevated dust concentrations may impair downstream equipment, pose explosion risks (in combustible dust contexts), or degrade air quality for staff and nearby communities. In short: the dust monitor is not a luxury—it’s a strategic sensor in modern process plants.
Why Does a Dust Monitor Matter Inside a Modern CEMS Framework?
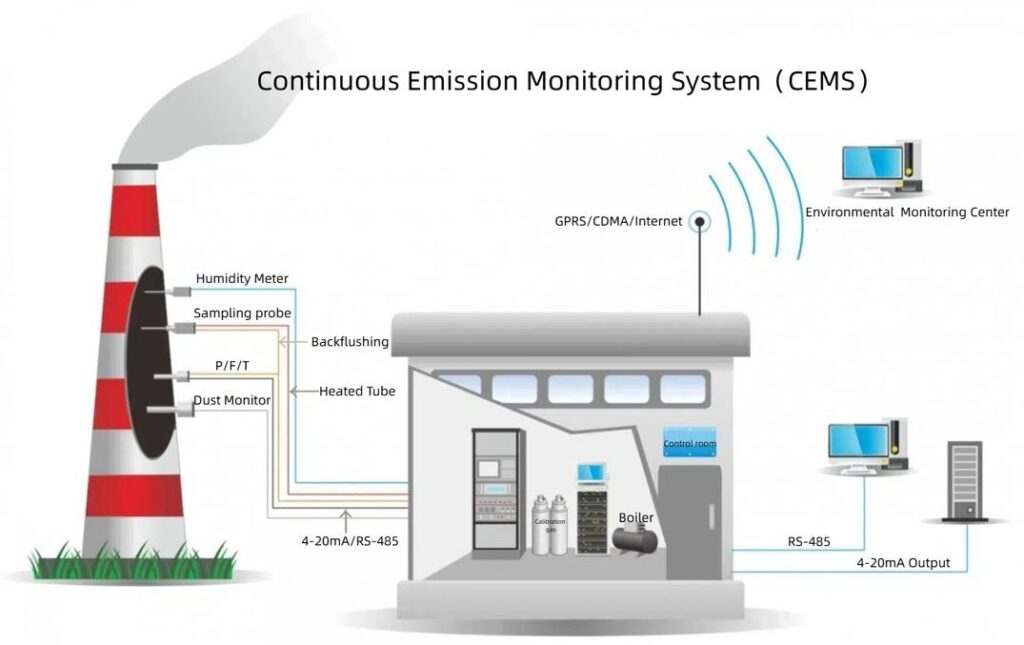
A Continuous Emission Monitoring System (CEMS) tracks key pollutants in real time, and a dust monitor forms one of its core modules. It sits on the stack, where the monitor reads particulate matter directly from the flue gas stream. This link gives plants a clear picture of their PM levels and keeps the data traceable and continuous. The dust monitor works with the same sampling path as other CEMS devices, yet it focuses on solid particles rather than gases. This role makes it essential for any site that needs reliable PM-CEMS data and long-term emission reporting.
Regulations add another layer of pressure. Plants need stable data, transparent records, and proof that dust emissions stay within limits. Real-time readings help teams respond fast when filters leak, ducts foul, or combustion shifts. This constant stream of data also strengthens plant accountability, because every trend tells a story: rising load, bag failure, or poor process control. The monitor becomes a practical tool rather than only a compliance instrument.
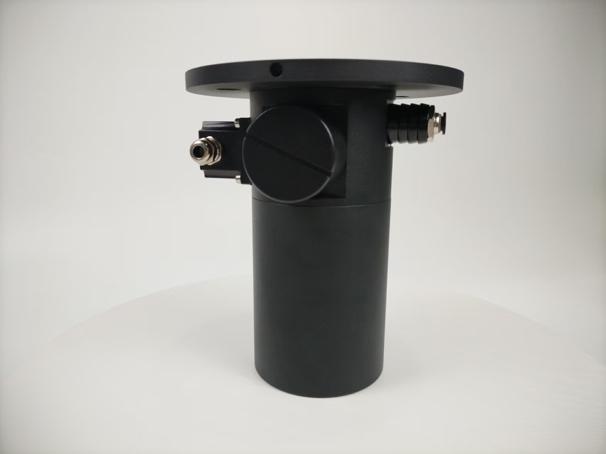
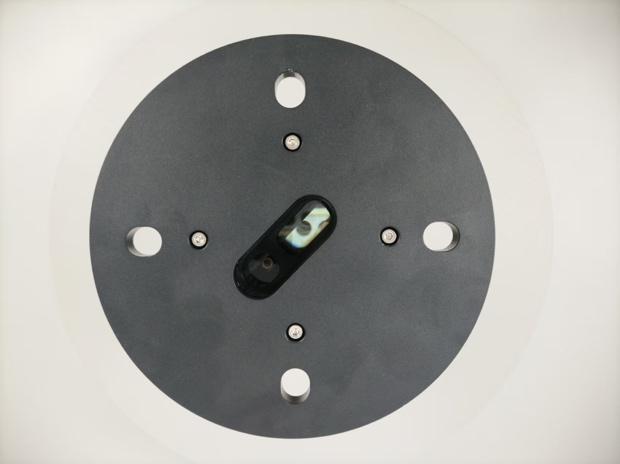
A dust-monitoring subsystem includes several parts that work together. The probe reaches into the stack. The measurement unit generates signals through optical transmission, forward scattering, or beta attenuation. These signals then move into the data-acquisition system, where the plant converts them into meaningful dust-concentration values. Each part serves a specific function, yet they must stay aligned to handle flow changes, vibration, and temperature swings in the stack.
Dust monitors also face very different challenges than gaseous analyzers. Gases stay stable if the sampling system works well, but dust does not. Particle size changes with the process, loading shifts with the filter condition, and deposition on windows or probes can distort readings. High temperature, uneven gas flow, or sticky particulate can add more uncertainty. These factors make dust measurement a practical engineering discipline that calls for careful design, steady maintenance, and a clear understanding of plant conditions.
How Does a Dust Monitor Convert Raw Signals into Dust Concentration and Emission Rates?
Understanding how a dust monitor measures particulate matter is essential for anyone responsible for CEMS performance. If you want to know principles, selections, and application, read our blog “Principle of Dust Monitor In Flue Gas Online Monitoring System, Selection and Application”.
Dust monitors do more than flash alarms—they translate physical signals into meaningful numbers that plants report to regulators. This conversion relies on structured formulas that tie electrical responses, process conditions, and stack flow into a single, defensible emission value. Understanding these formulas helps operators judge data quality and catch errors before they impact compliance.
The starting point is the basic concentration formula:
Concentration (mg/m³) = kᵦ × Instrument Signal.
The calibration factor kᵦ links the instrument’s output to a known particulate load. Technicians derive it by exposing the monitor to a standard dust concentration and recording the device’s response. A stable kᵦ anchors the reading to real particulate mass, while drift in this factor often signals fouling, optical shift, or sensor aging. This single multiplier may look simple, but it reflects the entire calibration history of the device.
However, raw concentration is only the first step. Plants usually convert this value to standardized conditions, so results are comparable across time and equipment. A common correction formula is:
Cₙₒᵣₘ = Cₘₑₐₛᵤᵣₑd × (Pᵣₑf / Pₐctual) × (Tₐctual / Tᵣₑf) × (other factors).
These adjustments account for stack pressure, gas temperature, moisture removal, and oxygen normalization. Each correction serves a purpose. Pressure affects gas density, temperature reshapes volume, moisture changes the dry-basis reading, and oxygen correction aligns the values with regulatory limits. When operators apply these corrections correctly, they ensure their final number reflects true emission behavior rather than shifting process conditions.
Once operators have a normalized concentration, they convert it to an emission rate. The relationship is direct:
E = C × Q,
where E is the emission rate (kg/h), C is the dust concentration (mg/m³), and Q is the volumetric flow (m³/h). Units matter here. Plants often convert mg to kg and adjust flow to standard conditions to avoid mismatched scales. This simple multiplication connects stack chemistry with plant operations, showing exactly how much particulate mass leaves the chimney each hour.
To ground these ideas, consider a cement plant stack. Assume the dust monitor reads a normalized concentration of 45 mg/m³. The flue gas flow is 320,000 m³/h. The emission rate becomes:
E = 45 mg/m³ × 320,000 m³/h = 14,400,000 mg/h, which converts to 14.4 kg/h. This number, not the raw monitor signal, is what regulators and plant managers rely on to judge environmental performance. It also reveals why stable flow measurement and accurate normalization are as important as the dust monitor itself.
Accuracy is never an afterthought. Plants perform relative accuracy tests to check whether the dust monitor matches independent reference methods. They also track drift limits to ensure readings stay within acceptable bounds. Many regulations use a “≤10% deviation” rule during calibration checks. If the instrument exceeds that limit, operators must adjust or recalibrate. These tests protect data integrity and keep the reporting system trustworthy over the long haul.
What Are the Best Ways to Clean and Maintain a Dust Monitor for Long-Term Accuracy?
Keeping a dust monitor clean is not optional; it is central to reliable CEMS performance. Dust tends to settle on probe surfaces, optical windows, and filters. Over time, these deposits cause signal drift, clog sampling lines, and distort particulate readings. A well-maintained system responds faster, stays aligned with reference methods, and reduces the risk of unexpected compliance issues. This is why many plants treat cleaning as part of their routine emission-control discipline.
Daily and weekly tasks keep the system stable. Operators usually start with a short probe purge or blow-back to clear loose particles. They then check or replace inline filters, wipe optical windows, and inspect the sampling line for early signs of fouling. These simple actions prevent heavy buildup and keep the measurement path open. They also help technicians catch problems before they show up as inconsistent data.
Monthly or quarterly work goes deeper. Teams remove the probe to inspect the full length of the sampling path. They run self-checks on the electronics, verify calibration, and review lamp intensity if the device uses optical scattering or extinction. These checks reveal slow drift or aging components that daily cleaning cannot detect. Plants that follow this schedule often see fewer surprises during audits or regulatory performance tests.
A clear cleaning procedure makes the work safer and more consistent. The typical sequence is straightforward. First, technicians isolate the system to prevent accidental exposure. Then they perform a purge or blow-back to remove loose dust. After that, they remove the filter or probe and clean all optical surfaces with lint-free materials. When the surfaces are inspected and cleaned, they install a new filter element, run a zero and span calibration, and document the entire process. This record becomes part of the plant’s traceability chain.
Troubleshooting also plays a key role in maintenance. Upward signal drift often indicates dust loading on the probe or optics. A zero shift may point to electronic issues or contamination on the optical window. Poor representativeness could signal a sampling location problem, especially if gas flow is uneven. High flow loss usually means blockage in the sample line. Understanding these patterns helps operators solve issues quickly and avoid unnecessary downtime.
Finally, strong documentation protects both the plant and the data. Maintenance logs, calibration records, and downtime notes help auditors understand how the dust monitor was maintained through the year. These logs also build trust in the reported values and support the plant’s compliance strategy. When maintained well and documented clearly, a dust monitor becomes not just an instrument, but a dependable part of a plant’s environmental management system.
Conclusion
We looked at three major areas: the working principles of industrial dust monitors, the calculation formulas that underpin concentration and emission-rate reporting, and the cleaning and maintenance practices that sustain accuracy. First, you saw how dust monitors convert physical phenomena into measurable data. Next, you learned how calibration factors, normalization formulas and flow-based calculations turn signals into mg/m³ and kg/h emissions. Finally, we stressed how routine cleaning, scheduled maintenance, and documentation keep your system reliable. Together these pieces form the backbone of trustworthy particulate monitoring.
A well-maintained dust monitor does far more than check boxes for compliance. It bridges the gap between regulatory obligation and operational insight. When you trust your particulate readings, you can optimize baghouse performance, fine-tune combustion, prevent hidden filter leaks—and that means fewer surprises, cleaner emissions, and smarter production.
For further technical support or consultation on dust-monitor integration, calibration strategy, or maintenance workflows, feel free to reach out. Our team specializes in CEMS and particulate monitoring solutions—and we’re glad to help your plant turn measurements into meaningful action.
FAQs:
Q1. What is an industrial dust monitor in a CEMS and why does it matter?
An industrial dust monitor within a Continuous Emissions Monitoring System (CEMS) measures particulate matter (PM) continuously in flue gas streams. It matters because it delivers real-time data on dust concentration, supports compliance with emission limits, and gives operational insight into filtration, combustion or filter performance. Reliable dust monitoring bridges regulatory obligations and process optimization.
Q2. Which measurement technologies do dust monitors use and how do they differ?
Dust monitors typically use one or more of the following: optical scattering or extinction, beta-attenuation, and TEOM (tapered element oscillating microbalance). For example: optical scattering uses light deflection by particles; beta-attenuation uses the attenuation of beta-radiation through dust deposits; TEOM measures mass via frequency change when particles accumulate. Each method has strengths and limitations, so selection depends on dust load, particle size, stack conditions and maintenance capability.
Q3. How is dust concentration calculated using monitor signals?
The basic formula is: Concentration (mg/m³) = Calibration factor (kₐ) × Instrument signal (e.g., mV, Hz, counts). The calibration factor represents the instrument’s response slope derived from a known dust load. Operators often then apply correction formulas—for pressure, temperature, moisture and oxygen—to normalize the reading and ensure validity under changing stack conditions.
Q4. How is the emission rate calculated from concentration data?
Once you have a normalized dust concentration (mg/m³), you multiply it by the flue gas volumetric flow (m³/h) to get emission rate (kg/h): E = C × Q. It is critical that units align (e.g., convert mg to kg, use correct time interval). The emission rate gives the actual mass of dust leaving the stack per unit of time, which is what regulators and plant managers typically care about.
Q5. What routine cleaning and maintenance practices support accurate dust monitoring?
Cleaning and maintenance are crucial for trustworthy data from dust monitor. Key practices include:
- Daily/weekly: probe purge or blow-back, filter changes, optical window cleaning, sampling line inspection.
- Monthly/quarterly: full probe removal and inspection, calibration check, self-check electronics, lamp intensity verification.
- Documentation of every maintenance event.
These tasks minimize signal drift, filter clogging, deposition build-up and sampling bias.
Q6. What common issues should operators watch for and how do they troubleshoot them?
Common issues of dust monitors include:
- Upward signal drift → often due to dust accumulation on optics or probe surfaces.
- Zero shift → could be electronics, optics misalignment or contamination.
- Poor representativeness → may reflect bad probe placement or uneven flow.
- High flow loss → likely sampling line blockages or filter clogging.
When these patterns appear, the monitor’s data may lose traceability or accuracy.