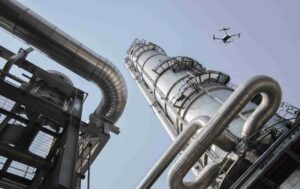
In a mid-sized chemical plant, engineers noticed that their emission readings from an infrared gas analyzer slowly crept upward over weeks. One day, the analyzer’s CO₂ reading triggered a compliance alarm—yet a parallel sensor in a nearby line registered no anomaly. The plant was forced to pause operations for an unscheduled audit. In this scenario, drift in the infrared gas analyzer cost both downtime and credibility.
This example highlights a harsh reality: even advanced infrared gas analyzers are not immune to long-term drift. Over time, subtle shifts in baseline, optical alignment, or component degradation lead to measurement errors. In regulated environments, these errors can cascade into false alarms, squandered feedstock, faulty control decisions, or regulatory penalties.
What Exactly Is Drift in an Infrared Gas Analyzer?
Definition & Types of Drift
“Drift” refers to a slow, systematic shift in measurement over time—distinct from random fluctuation. In the context of an infrared gas analyzer, we can classify drift into four common types:
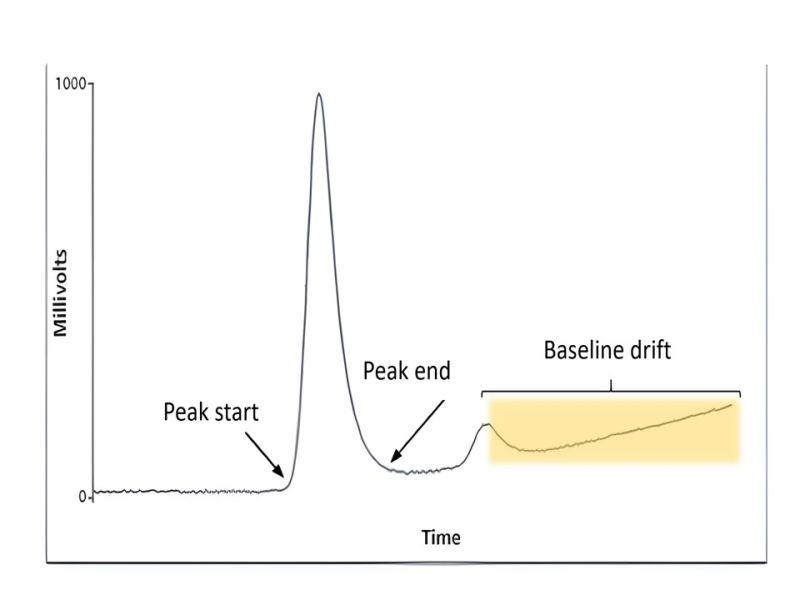
- Zero drift (baseline drift) — the measured zero point gradually moves away from true zero.
- Span drift (gain drift) — the slope or sensitivity of the analyzer changes, so the full-scale response shifts.
- Long-term drift (trend drift) — a steady, prolonged drift over weeks or months, often caused by aging components.
- Short-term fluctuations (transient drift) — temporary deviation lasting minutes to hours, triggered by environmental changes or transient interference.
These categories may overlap in real operation. Recognizing which type dominates helps engineers apply the right diagnostics and fixes.
Mechanism: Why Drift Matters in IR (Beer–Lambert Context)
Infrared gas analysis relies fundamentally on the Beer–Lambert law:
I= I₀×exp(− ε⋅c⋅L)
- I₀ = initial light intensity
- I =transmitted light intensity after absorption
- ε =absorption coefficient of the target gas
- c =gas concentration
- L =path length of the optical cell
Drift occurs when something shifts I₀ or affects ε, c, or L in hidden ways. Common mechanisms include:
- The light source weakens or ages, thus lowering I₀ over time.
- Optical surfaces or windows become contaminated (dust, films, condensation), reducing transmission.
- Temperature, pressure or humidity changes alter gas density (c) or absorption coefficient (ε).
- Adsorption or desorption of gas molecules on surfaces in the optical path alters local concentration.
Because the law is exponential, even a small change in I₀ or ε can produce noticeable drift in the calculated concentration. That sensitivity magnifies long-term error.
Distinguishing Drift vs. Noise vs. Bias
It’s important to distinguish three often-confused error types:
- Noise is random, fast, and unpredictable (ms to seconds scale).
- Drift is slow, gradual, and systematic (minutes to days).
- Bias (offset error) is a fixed, constant deviation—static error that doesn’t change over time.
In other words, drift is not a sudden jump or random spike. It creeps in. Over time, drift can accumulate biases or shift baselines. Recognizing that distinction helps avoid misdiagnosis: you don’t treat drift like noise or bias.
What Are the Main Root Causes of Drift in an Infrared Gas Analyzer?
Understanding what drives drift is essential for any plant engineer or technician working with infrared gas analyzers. Drift rarely stems from a single reason — instead, it often results from multiple small effects adding up over time. Let’s break down the most common root causes and what engineers should look for on site.
| Category | Common Cause(s) | Mechanism / Example | What Engineers Should Notice / Mitigate |
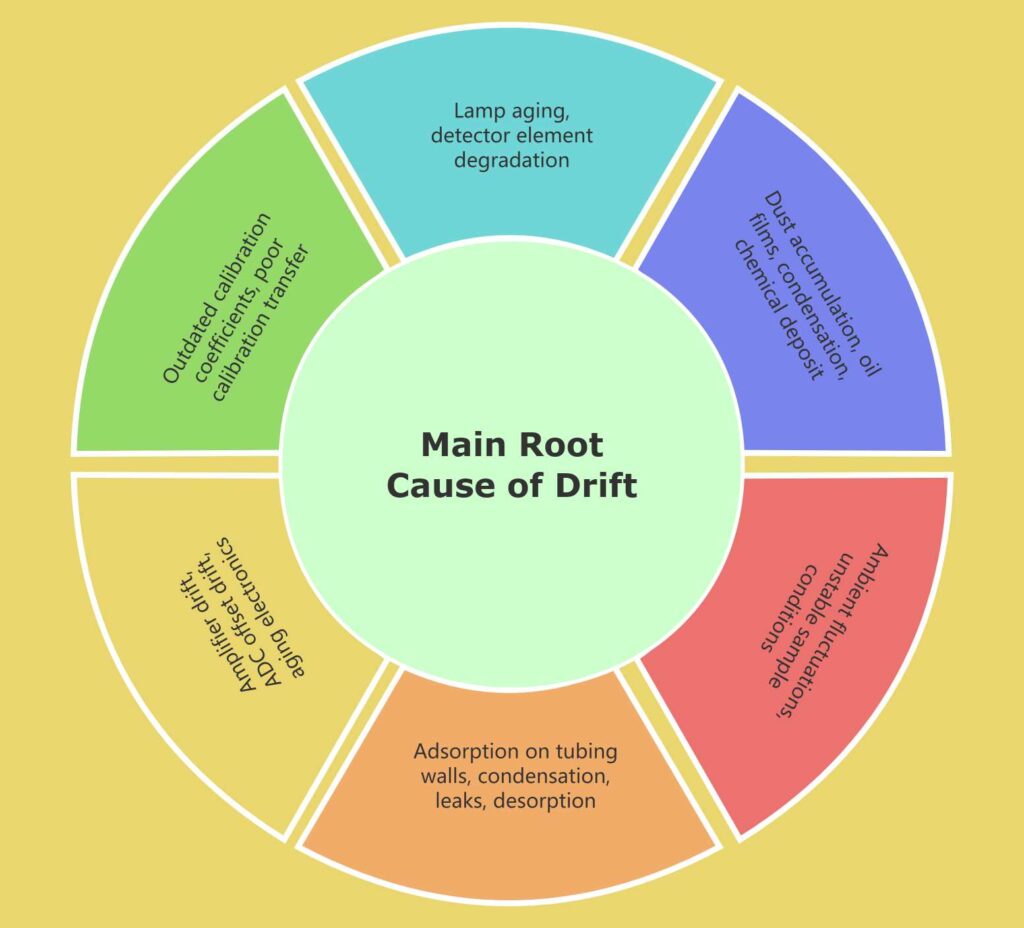
| Light Source & Detector Aging | Lamp aging, detector element degradation | The light source output gradually weakens; detector responsiveness slows; this shifts baseline or reduces sensitivity | Choose ultra-stable light sources, periodically measure optical power, plan replacements before drift gets large |
| Optical Path Contamination | Dust accumulation, oil films, condensation, chemical deposit | Contaminants darken windows or optical surfaces, scattering or absorbing light and altering transmission | Use dust shields or purge systems, set cleaning schedules, monitor transmission or reference path performance |
| Temperature / Pressure / Humidity Variations | Ambient fluctuations, unstable sample conditions | Gas density (c) and absorption coefficient (ε) change with T, p, humidity, altering the apparent concentration | Include T / p / humidity sensors and compensation, regulate sample environment, isolate instrument from thermal cycling |
| Sampling System Issues | Adsorption on tubing walls, condensation, leaks, desorption | Gas species cling to tubing or condense, then release later; leaks allow air ingress | Use inert materials (PTFE, stainless), heat and insulate lines, minimize tube length and bends, audit tightness of all joints |
| Electrical / Electronic Drift | Amplifier drift, ADC offset drift, aging electronics | Baseline voltage shifts or gain changes in signal chain distort the analog → digital conversion | Design differential circuits, use baseline sampling modes, schedule periodic electronic calibration or zero checks |
| Calibration / Migration Error Accumulation | Outdated calibration coefficients, poor calibration transfer | When calibration is applied incorrectly or infrequently, small errors compound over time | Adopt dual-point or multipoint calibrations, cross-validate with reference instruments, maintain calibration records and schedule |
In short, every infrared gas analyzer is vulnerable to drift — but not helpless against it. Most problems trace back to predictable physical or environmental processes. Recognizing early warning signs and enforcing preventive maintenance can dramatically extend analyzer stability and data reliability.
What Risks Does Drift in an Infrared Gas Analyzer Pose to Plant Operations?
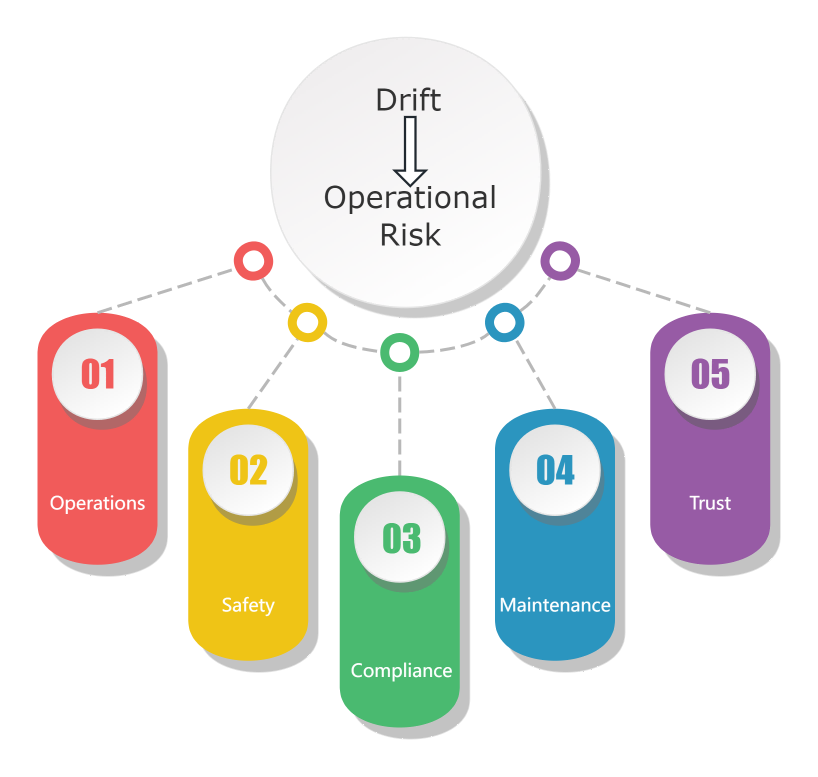
Drift in an https://esegas.com/product/ndir-gas-analyzer/ is not just a technical nuisance—it has ripple effects throughout operations, safety, compliance, and trust. Below we examine how drift translates into real operational risks.
1.Measurement Error & Signal Distortion
When drift creeps in, two main distortions occur:
- Zero shift or zero drift shifts the baseline upward or downward.
- Span drift alters the slope, meaning full-scale readings no longer map correctly to gas concentration.
Together, these effects pull measured values off true concentrations. The result? False alarms or missed alarms, plus misinterpretation of trends. In short, drift warps data integrity.
2.Risks to Process Control
If your control system relies on gas readings, drift can feed it wrong data:
- You may deliver incorrect control signals—e.g. over-adjust oxygen feed, mismanage combustion, or misbalance emissions.
- Under certain conditions, drift could lead to unsafe decisions, especially if gas levels are near critical thresholds but misread as safe.
Thus, drift undermines closed-loop control and opens a safety gap.
3.Compliance & Emissions Reporting Exposure
In regulated industries, measured gas concentrations feed compliance reporting. Drift can push apparent emissions out of spec—even if the real process meets standards. Worse, you risk:
- Failing environmental audits
- Incurring fines or forced shutdowns
- Losing your emissions permit
Since regulators expect stable, traceable data, drift undermines both legal standing and corporate reputation.
4.Creep of Operational & Maintenance Costs
Drift forces remedial and preventive efforts:
- You’ll calibrate more often, interrupting production.
- You may shut down equipment more frequently to verify or repair.
- Component stress from corrective actions accelerates wear, shortening instrument life.
Over time, these costs accumulate far beyond the cost of smart drift management.
5.Trust Loss & Data Traceability Breakdown
Finally, drift erodes confidence:
- Operators and engineers may start doubting measurement outputs.
- Management may distrust historical gas data, reducing utility in trend analysis or process optimization.
- As confidence fades, teams may over-correct or arbitrarily dismiss anomalous readings.
With trust broken, even a perfect repair won’t fully restore data credibility.
In sum, drift in infrared gas analyzers threatens measurement accuracy, process control, compliance, cost efficiency, and organizational confidence. Guarding against drift isn’t optional—it’s central to reliable, safe, and high-integrity gas analysis.
How Can You Mitigate Drift in an Infrared Gas Analyzer — From Design Through Operations and Maintenance?
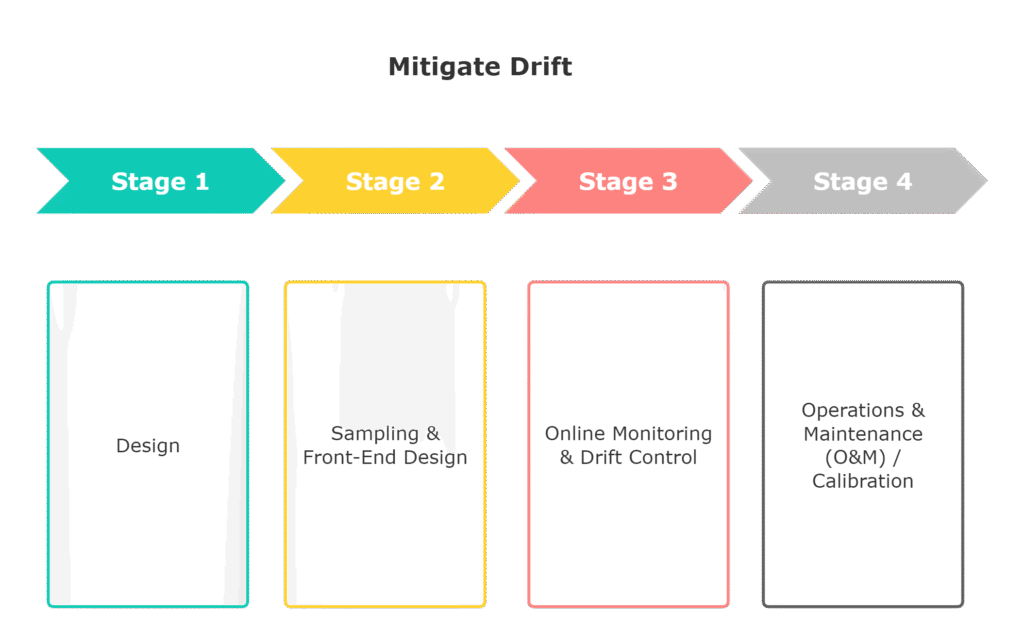
In this section, we lay out a life-cycle-oriented road-map for combating drift in infrared gas analyzers. We move step by step — from design choices, through online controls, to operations & maintenance (O&M). Each phase carries trade-offs, so you’ll see not just what works, but when and how to apply it in real plants.
| Phase / Stage | Strategy / Approach | Details / Example | Pros, Cons & Key Notes |
| Design / Predeployment | Redundant or self-reference optical path | Embed a parallel reference channel or vacuum path that measures baseline / source output (e.g. IR reference measurement) | Pros: Strong drift cancellation, continuous correction. Cons: Adds complexity, cost, precise matching required. |
| Use highly stable components & inert materials | Select low-attenuation windows, anti-soiling coatings, inert piping (PTFE, SS) | Pros: Passive resistance to contamination. Cons: Higher cost; must still endure temperature/pressure stress. | |
| Environmental conditioning | Enclose analyzer in temperature / humidity controlled housing, vibration isolation | Pros: Reduces external disturbance. Cons: Extra maintenance, energy cost, risk of environmental systems failure. | |
| Sampling & Front-End Design | Heated / insulated / pressurized sampling lines | Maintain sample above dew point, avoid condensation or adsorption | Pros: Reduces wall effects and moisture artifacts. Cons: Higher power demand, possible line reliability issues. |
| Short path, minimal bends, inert inner lining | Route tubing to minimize length and bends, use lining to reduce adsorption | Pros: Less gas–surface interaction, fewer drift sources. Cons: Field layout constraints may limit ideal routing. | |
| Online Monitoring & Drift Control | Scheduled automatic zero (baseline) checks | During measurement cycles, divert or insert zero gas path to measure baseline drift | Pros: Detects drift early. Cons: Requires hardware support, may slightly slow measurement throughput. |
| Dual-channel / reference compensation | One channel measures reference (vacuum or blank), other measures gas; subtract or ratio to cancel drift | Pros: Real-time drift suppression. Cons: Needs optical balance, matched detectors. | |
| Software drift correction / filtering | Use adaptive models, drift compensation algorithms, filtering of slow trends | Pros: Flexible and updatable. Cons: Must validate thoroughly to avoid over-correction. | |
| Operations & Maintenance (O&M) / Calibration | Regular zero/span calibration | Use known calibration gases (zero gas, span gas) on scheduled intervals | Pros: Resets accumulated errors. Cons: Operational downtime, gas cost, labor. |
| Drift trend monitoring & predictive alerts | Analyze historical drift behavior, set thresholds for alerts before failure | Pros: Proactive maintenance. Cons: Requires sufficient data, tuning of thresholds. | |
| Clean optics & replace degraded parts | Periodic cleaning of windows, mirrors, filters; replace aged optical components | Pros: Restores optical clarity. Cons: Must be done carefully to avoid damage or misalignment. | |
| Cross-calibration / inter-instrument validation | Compare measurements across multiple analyzers or against reference lab instruments | Pros: Validates measurement integrity. Cons: Additional instrumentation or reference needed, extra cost. |
Practical Trade-offs & Integration Guidance
- At design time, invest in redundancy and stability when reliability is critical (e.g. emissions monitoring).
- In field instrumentation, lean on dual channels and periodic zeroing to catch drift early.
- For mature plants, focus O&M budget on trend analytics, optics care, and cross checks.
- Always validate software corrections against physical calibrations to avoid false correction loops.
By combining thoughtful design, intelligent runtime monitoring, and disciplined maintenance, you can keep your infrared gas analyzer’s drift well within acceptable limits — ensuring stable, trustworthy measurements over the long term.
Conclusion: Managing Drift in Infrared Gas Analyzers
Drift in infrared gas analyzers is an inevitable phenomenon resulting from various factors such as component aging, environmental changes, and calibration inconsistencies. While it poses challenges, a structured approach encompassing design considerations, real-time monitoring, and proactive maintenance can significantly mitigate its impact.
We are happy to discuss and share different experiences with drift challenges in infrared gas analyzers. What strategies have you employed to address drift in your operations? Your insights can contribute to a broader understanding and improvement of practices in the field.
FAQ: Why Does Your Infrared Gas Analyzer Drift Over Time?
Q1: What causes drift in an infrared gas analyzer?
A: Drift in an infrared gas analyzer stems from multiple interacting factors: aging of the light source or detector, contamination or deposits on optical surfaces, fluctuations in temperature/pressure/humidity, adsorption or desorption in the sample path, electronic circuit drift, and cumulative calibration errors. Over time, these factors nudge the measurement baseline or sensitivity away from its original calibration.
Q2: How can I tell if my infrared gas analyzer is drifting rather than just noisy?
A: Noise shows up as rapid, random fluctuations around a mean value. Drift, on the other hand, is a slow, systematic trend changing over minutes, hours, or days. If you observe a gradual shift in zero or span (baseline moving upward or downward, slope changing) under stable conditions, that’s drift—not noise. Bias is a static offset that does not change with time.
Q3: What impact does drift in an infrared gas analyzer have on process control?
A: Drift can mislead control systems by feeding them incorrect gas concentration data. This may cause the system to over-correct (e.g. add too much oxygen), or under-react in critical conditions. In extreme cases, drift can lead to wrong safety decisions if gas concentrations near thresholds are misreported.
Q4: How often should I calibrate my infrared gas analyzer to mitigate drift?
A: The optimal calibration interval depends on operating conditions (e.g. temperature swings, contamination risk) and application criticality. A good practice is to combine regular zero/span calibrations with drift trend monitoring, so you can adjust intervals dynamically. In critical settings, calibrate infrared gas analyzer more frequently (e.g. monthly or weekly); in stable, low-risk ones, quarterly or semiannual calibrations might suffice.
Q5: Are there design strategies to reduce drift in an infrared gas analyzer from the start?
A: Yes. Good design can greatly reduce drift susceptibility. Key strategies include:
- Embedding a reference or redundant optical path for self-correction
- Choosing high stability components (low drift light sources, inert materials)
- Housing the instrument in controlled environments (temperature, humidity)
- Designing sampling systems with heated, short, inert, minimal-bend lines to avoid gas adsorption or loss
Q6: Can software algorithms fully compensate drift in an infrared gas analyzer?
A: Software in infrared gas analyzer helps—but it cannot fully substitute proper design and maintenance. Drift compensation algorithms (filtering, adaptive models) can reduce residual bias, but they must be anchored by periodic physical calibration and validated carefully. Over-correcting or relying solely on software can introduce new errors.
Q7: What should I do if my infrared gas analyzer’s zero or span controls are maxed out?
A: If potentiometer or adjustment knobs cannot correct zero or span (e.g. they are at their limits), this suggests the drift has exceeded the internal correction range—possibly due to contamination, severe aging, or optical degradation. In that case, clean optical paths, replace degraded components, or send the analyzer back for factory calibration.